It seems like there’s a never-ending array of commands for Linux administrators to remember. Some are for file manipulation, others manage hardware and others configure services or databases.
Network connectivity is a critical part of Linux server functionality. Read on to learn nine commands that cover most network management needs on Linux devices. Some of these tools are built-in, while others must be added using a package manager.
4 Configuration Commands
There are some fundamental approaches to troubleshooting or investigating the configuration of network nodes. One of the first steps is to identify the current configuration, including IP address, subnet mask and interface settings.
1. The IP Command
The IP command is available by default on many Linux distributions these days. The command and related subcommands are very flexible, allowing administrators to display and change IP address settings.
To display IP addresses for all interfaces, type:
# ip addr
This command shows the current IP address and subnet mask for all interfaces on the system. Specify a particular interface by using ip addr show enp0s3, as seen below:

Figure 1: The IP addr shows enp0s3 command
Don’t forget that the ifconfig command, if available on your preferred distribution, shows similar information.
There are a few variations of the IP command to keep in mind. For example, it displays route and link information:

Figure 2: The IP route command

Figure 3: The IP link shows enp0s3 command
2. The nmcli command
Your favorite Linux distribution may handle network connections by using NetworkManager. NetworkManager has both graphical user interface (GUI) and textual user interface (TUI) utilities, but in this case, I’ll focus on the command line interface (CLI) tool.
Device information is displayed with the nmcli connection show command (abbreviated to nmcli con). The output shows the link name, user identifier (UID), type and device name.
Figure 4: The nmcli con command
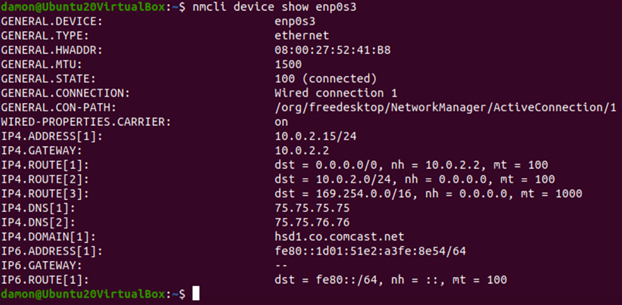
Additional device information can be displayed on a per-device basis with the device show subcommand. Here is an example:

Figure 5: The nmcli dev shows enp0s3 command
It’s also useful to confirm that the interface is enabled by using nmcli dev status.

Figure 6: The nmcli dev status command
3. The dhclient Command
Most Linux servers are configured with static IP addresses. But workstations and other devices are likely to be dynamic host configuration protocol (DHCP) clients. These devices lease an IP address configuration from a DHCP server.
Periodically, the leased information may be out of date due to recent network changes. In that case, it’s useful to initiate a new DHCP lease generation process.
The dhclient command is used to both drop and then lease an IP address configuration from the DHCP server. First, use the command with no options, and then add the -r option to initiate the new lease.

Figure 7: The dhclient and dhclient -r commands
Windows administrators will likely be familiar with using ipconfig /release and ipconfig /renew to accomplish the same task.
4. The ethtool Command
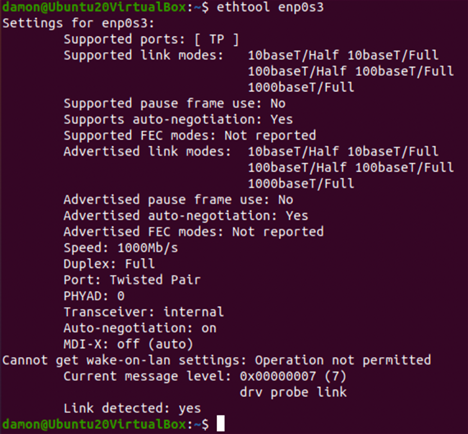
The ethtool utility allows systems administrators to configure network interfaces. Many options are available, including speed, duplexing, wake-on-LAN and driver information, among other settings.

Figure 8: The ethtool enp0s3 command
By querying ethtool, a systems administrator can discover the capabilities of a network interface card (NIC), thereby determining whether support for options such as remote wake-on-LAN features is available. Additional information can be useful for confirming that switch and NIC speeds are compatible, and duplexing is enabled.
5 Connection Utilities
The above commands allow administrators to verify the current system’s network configurations. What if those settings are all correct? How can systems administrators gather information about how those settings are being used?
1. The ss Command
The ss command displays current connections to the system and replaced the venerable netstat utility. It shows detailed information on socket statistics to aid in troubleshooting and performance monitoring. If you need to display current connection information for your Linux server, ss is the command to turn to.
The ss command, without options, displays existing connections to transmission control protocol (TCP) sockets on the host. An unmodified ss command displays a great deal of output. Filtering that output is the secret to receiving helpful information.
For many systems administrators, the first useful option will be the -4 switch, which displays IPv4 data. Many internal networks have not yet migrated IPv6. In addition, the results can be displayed for TCP or user datagram protocol (UDP) connections by using the -t and -u options, respectively.
Even more practical is output displayed based on the state of connections. A basic example is the display of listening sockets:

Figure 9: The ss -4 state listening command
It’s also possible to display output for specific connections by specifying the destination IP address, as seen below with the sample destination of 192.168.2.200:
# ss dst 192.168.2.200
The ss utility is a powerful replacement for netstat, but it certainly requires some dedication to learn.
2. The nmap Command
Network mapper (nmap) scans for open ports on remote systems. It’s an incredibly powerful tool used for both nefarious and benevolent reasons. Consider it when attempting to troubleshoot situations where remote connections are unknown, fail or are refused.
There are many different types of scans available, including scans of entire subnets or against targeted hosts.
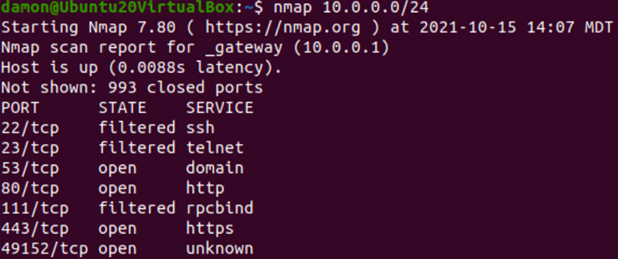
A basic scan of the 10.0.0.0/24 network looks like this:

Figure 10: The nmap command (output truncated)
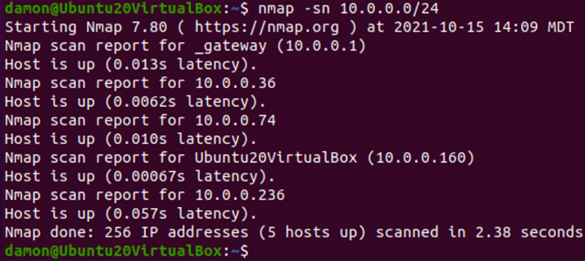
A quick scan displays hosts that are up on a network without displaying extra information (such as ports):

Figure 11: The nmap -sn 10.0.0.0 command
The power of nmap really shines when more specific scans are run. One of the most common uses is to display open ports on destination systems. While a scan can show all open ports, administrators often already know which port needs to be checked.
To confirm the status of port 22/tcp (the default port for secure shell (SSH)) on a server with an IP address of 10.0.0.1, type:

Figure 12: The nmap -p 22 10.0.0.1 command
Similarly, nmap can show port 22 results for an entire subnet with:
# nmap -p 22 10.0.0.0/24
To scan for the 25 most common ports, add the --top-ports 25 option:
# nmap --top-ports 25 10.0.0.0/24
Nmap is exceedingly powerful, and there are a great many more options. A general scan is useful, but systems administrators can really drill down into details using this tool.
For those who are more comfortable with graphical tools, consider ZenMap.
3. The tcpdump Utility
Both ss and nmap provide information about existing connections, but they do not tell systems administrators about how those connections are being used.
The tcpdump utility is installed on many Linux distributions. It intercepts network traffic, providing administrators with a look at what kind of information flows through the existing connections.
A basic tcpdump command looks like this:
# tcpdump -i enp0s3
The output is all traffic on the specified interface.
It is simple to specify traffic to or from a given IP address, such as 10.0.0.42. To do that, type:
# tcpdump host 10.0.0.42
However, there may be a great deal of information gathered in a very short time on a server with busy network connections. Try filtering the capture for the specific port of traffic you need.
Here’s a capture for port 80 traffic, along with verbiage to write the output to a file named webtraffic:
# tcpdump port 80 -w webtraffic
The file is not easy to read with a standard editor, but you can use tcpdump -r webtraffic or open the file by using Wireshark to display the contents in a more user-friendly format.
Of course, Wireshark provides similar functionality and has a very nice graphical interface.
4. The mtr Command
While tools like ping and traceroute are invaluable to network troubleshooters, the mtr command may be even more effective. It includes the functionality of standard tools and provides a look at network performance information, including dropped packets along a route. It automatically updates this information, giving systems administrators a look at real-time network performance.
A basic test looks like this:

Figure 13: The mtr command
In this case, I’ve targeted the localhost with mtr to display the available output values.
The mtr command also works by simply specifying an IP address rather than a fully qualified domain name (FQDN) or hostname.
If the output is too disorganized, try the -w option to display the results in a wide format. I typically run mtr with the -4 option so that it returns only IPv4 information.
The output includes the percentage of packets lost, the number of packets sent and several fields related to network performance. Because the results are displayed for each hop, administrators can pinpoint where communications are failing or which routers might be experiencing performance issues.
You can install mtr on Linux, macOS and Windows. In fact, Windows administrators might already be familiar with a similar tool named pathping.
5. The iperf Command
The mtr command can certainly provide valuable information about a network route, but what about the available bandwidth used by a specific server? That’s where the iperf utility comes in.
There are two basic ways of using iperf, either by targeting a destination server belonging to a hosting organization on the internet or by targeting one of your internal servers.
To use iperf internally, dedicate two systems. One acts as the destination server, while the other is the client. Install iperf on both systems.
To designate the destination device as the target server, use the -s option:
# iperf -s
A default port number is displayed. The client will use this connection to test performance.
Next, move to the client device. The -c option causes the device to run iperf in client mode. At a minimum, provide the target server’s IP address.
The command looks like this on the client, assuming the server’s IP address is 10.0.0.5:
# iperf -c 10.0.0.5
The output provides systems administrators with information regarding the server’s available bandwidth. However, testing a single connection to the server is not necessarily realistic. Most servers must support many simultaneous connections. Luckily, iperf can help with that.
Use the -p option to specify the number of parallel connections to the target, providing far more information about what the server’s actual network performance looks like.
# iperf -P 30 -c 10.0.0.5
Use iperf on Linux servers, of course, but be aware that there are versions for Windows, macOS, and even Android and iOS (iPhone). Consider the network testing possibilities with that much diversity.
Understanding Basic Network Commands
Linux server administrators are often responsible for critical services, including web and database roles. These services rely on network connectivity, and it behooves systems administrators to know several different basic network commands for configuration and troubleshooting. The nine commands listed here represent a solid list of utilities that play a significant role in maintaining network connectivity.
CompTIA Linux+ covers the skills needed to be a Linux administrator and use commands like the ones in this article. You can learn and practice your hands-on skills in one platform with CompTIA CertMaster Learn + Labs for Linux+. Sign up for your free trial today.


3 comments
Would love to have more on both Linus trainings and how to be good as a network guru
Linux and Security Plus completed by August...job requirement.
How do I get a list of the commands?